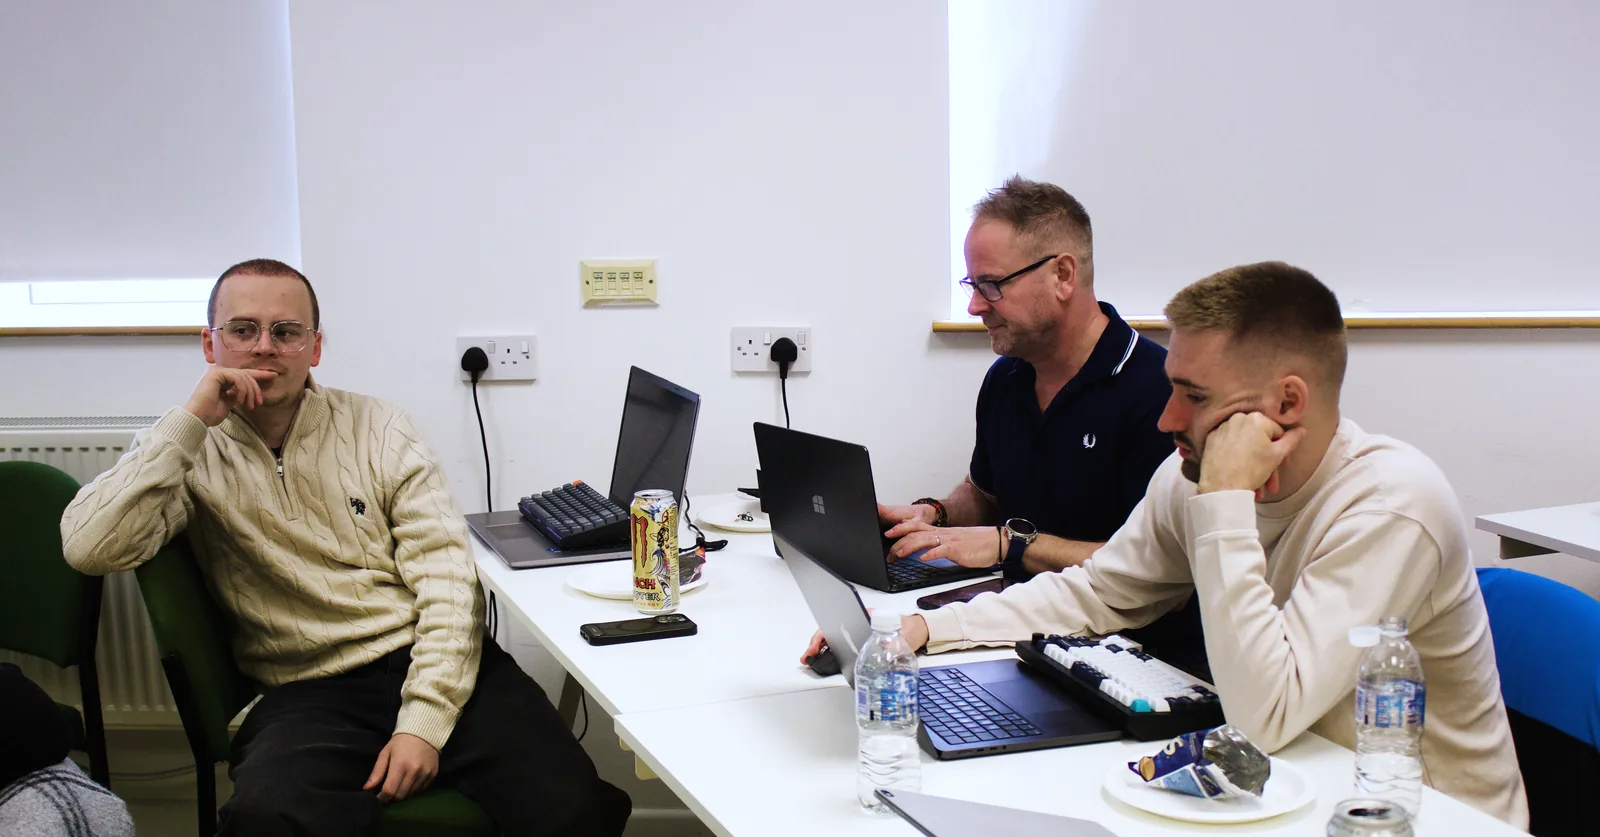
Do you even eye-track? Your analytics are telling you what happened, not why
Analytics dashboards show what your users do. Eye tracking and moderated UX research reveal what they actually think. Find out why you need both.

AF
Imran Ahmed
Head of Delivery
·
April 29, 2026
·
5 min read

Google Analytics. Hotjar. Microsoft Clarity. These are all powerful tools, but used in isolation, they can paint an incomplete picture.
They give you a detailed record of events like scroll depth, click coordinates, rage clicks and session duration.
And that level of detail can create a false sense of confidence, making you feel like you understand your users when you're actually just seeing where they've been.
Think about this: a user lands on your key conversion page, hovers over your CTA for three seconds, then leaves.
GA4 logs a bounce, and Hotjar or Clarity captures the movement.
But neither tool can tell you that the user was confused by a label next to the button, assumed it wasn't clickable and left. Your interface failed them, and nothing in your dashboard flagged it.
The gap between looking and understanding
One of the most consistent findings in eye-tracking research is the significant difference between what users look at and what they actually register.
Nielsen Norman Group's landmark studies on online reading made this clear: users scan rather than read. They glance at content without fully processing it.
And be honest ... how many words have you already skipped past in this post?
Mouse heatmaps and eye tracking are very different things
Mouse-tracking heatmaps are routinely cited as a stand-in for eye tracking. Research from Tobii has consistently shown the two correlate poorly. And on mobile, where no cursor exists (and where the majority of your traffic probably sits), heatmaps are generated purely from touch events. A user can read an entire paragraph, feel completely confused and never touch the screen. That whole mental journey stays invisible.
What no dashboard would have told us
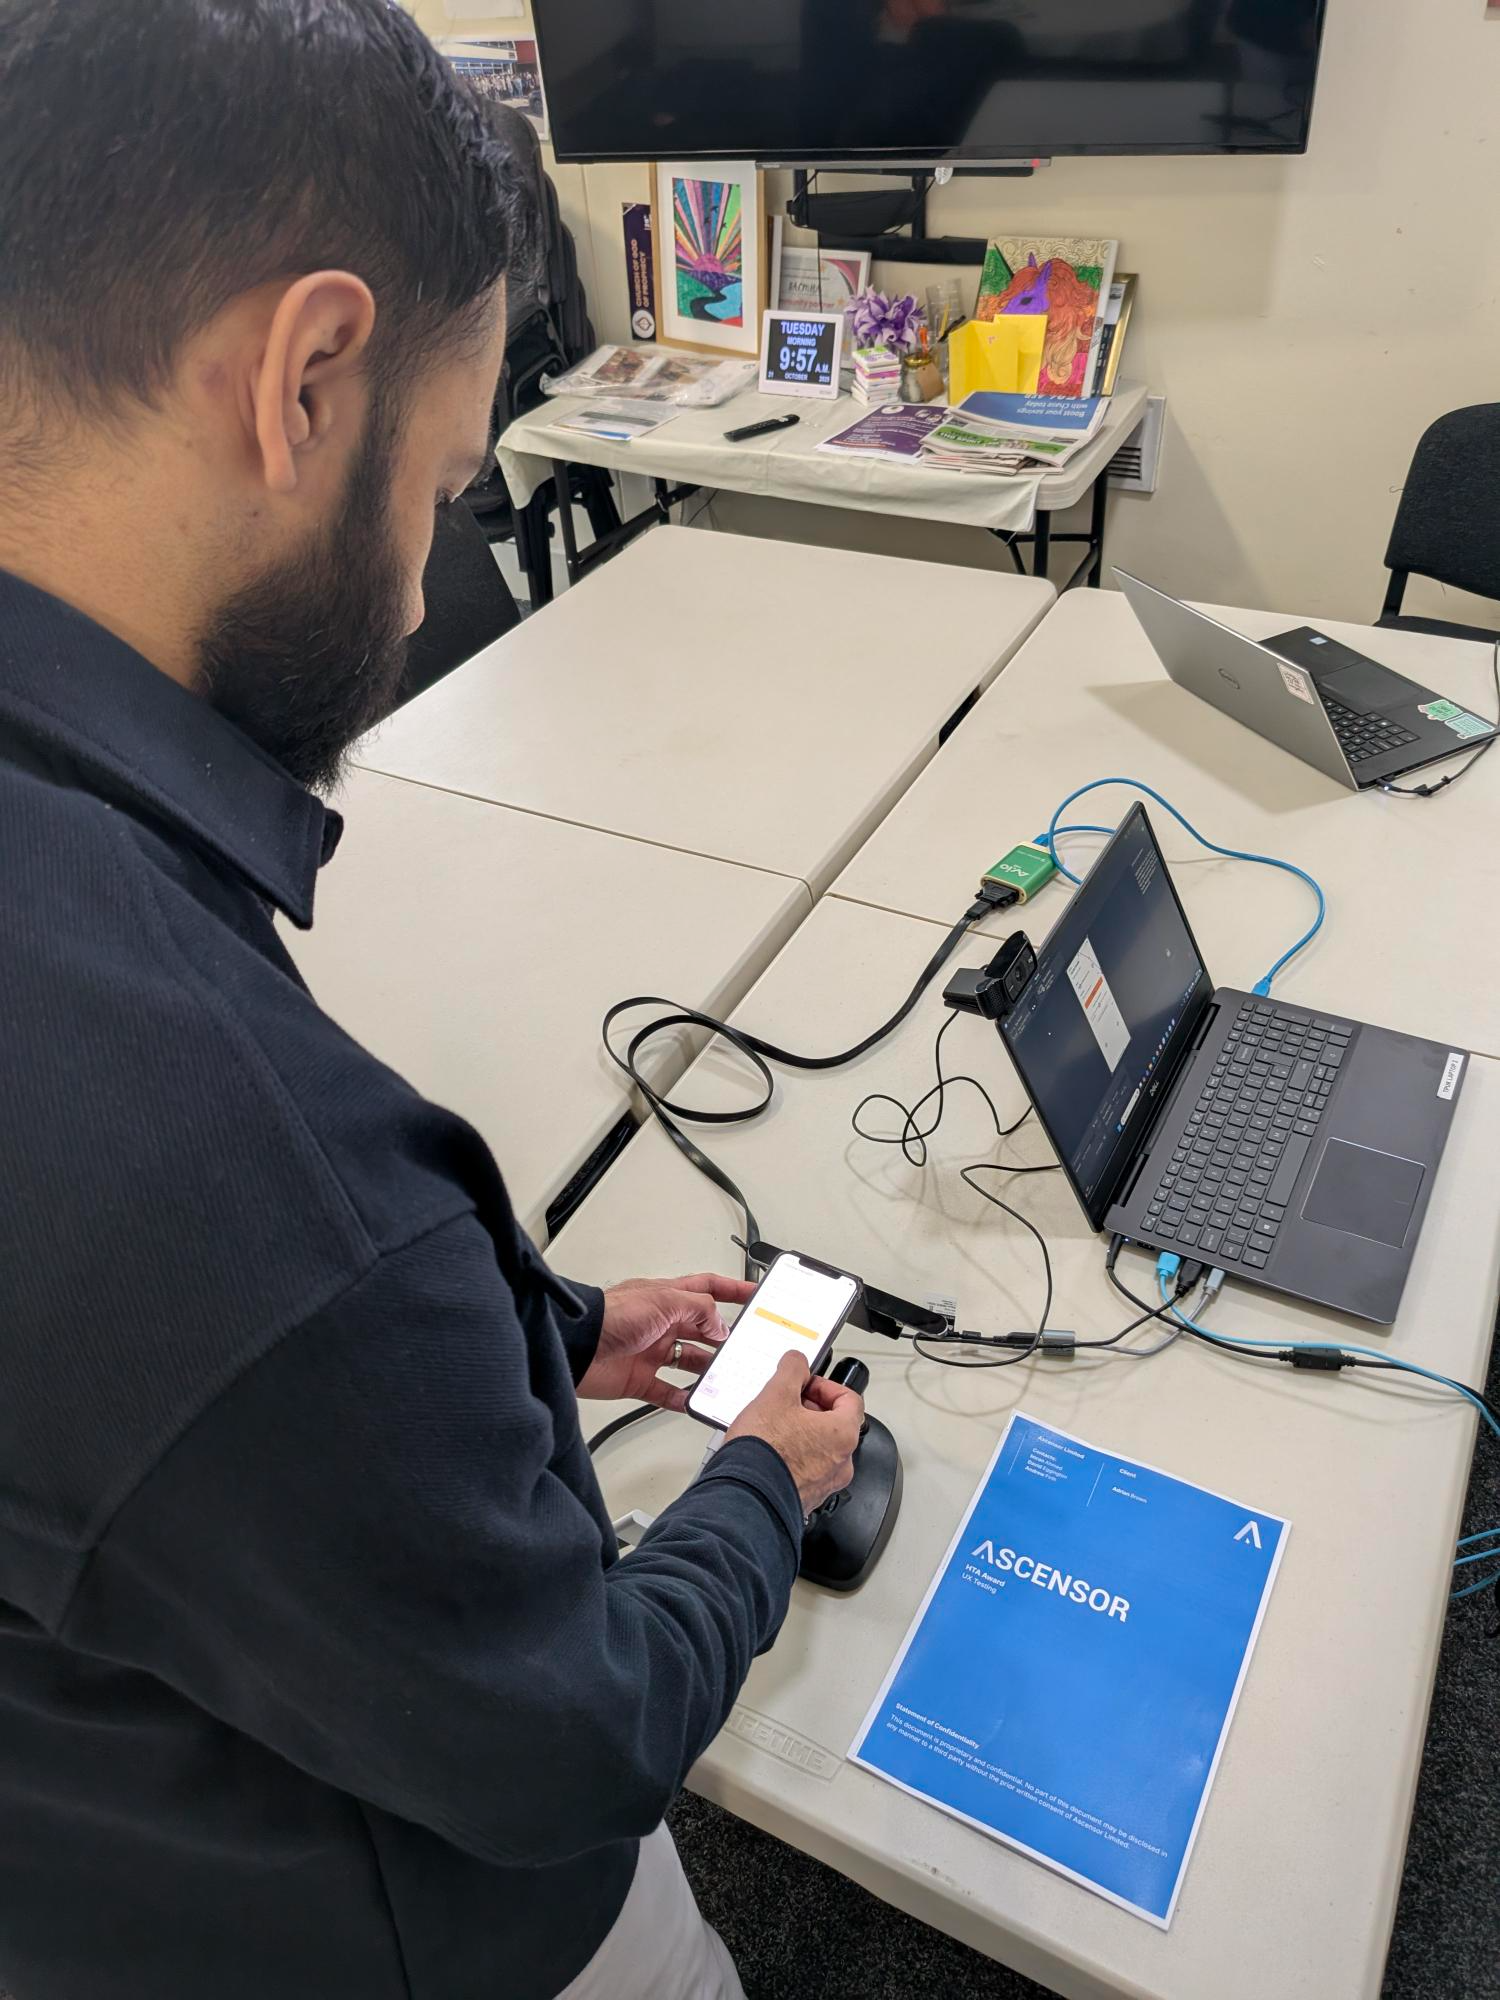
In a recent moderated UX study conducted across two UK cities using eye cameras and Think-Aloud protocol, we uncovered findings that standard analytics tools would never have surfaced.
Here’s one example, right at the end of the journey - after completing a health questionnaire, participants finished and immediately asked: "Where's the thank you? What happens to this now? Does my doctor see this?"
The task was done, but the emotional experience was unresolved.
No analytics tool can measure the anxiety of someone who just submitted sensitive health data and received silence in return.
In the same study, one participant described the questionnaire layout as a "swamp page." Two words, completely unprompted. A single observation like that contains more actionable insight than a thousand session recordings.
AI is useful here, but it has limits
AI is brilliant at spotting patterns in large datasets, finding funnel anomalies, behaviour clusters and drop-off points, which are all useful. But it works entirely from observable behaviour, the digital footprint people that leave behind.
A 2021 study in Behaviour & Information Technology found that users' self-reported usability scores frequently diverged from their observed behaviour.
People believed they understood something when they didn't, and described a task as easy after three failed attempts.
That gap can't be closed with data alone, it's a human problem that needs a human method.
Businesses and brands can do well by understanding what their users meant to do. And that understanding comes from being in the room, watching someone interact with your product in real time and hearing them explain what's working and what isn't.
The ROI case is clear
Forrester Research puts the return on UX investment at roughly £100 for every £1 spent. IBM found that fixing a problem at the design stage costs around 1/50th of fixing it after launch.
Every sprint you spend optimising the wrong thing, based on incomplete signals, is money spent moving nothing.
That insight is available to you, and most of your competitors aren't looking for it.
Your analytics are a starting point - they show you where people went and what they clicked. To understand the thinking behind those actions, you need to go further.
Eye tracking, moderated research and real user observation fill the gaps that dashboards leave open.
If you're ready to move beyond dashboards and start understanding your users properly, we can help.
Our team combines analytics, UX research and user testing to find out what's really going on with your website. If you're ready to move beyond dashboards and start understanding your users properly, we can help.
Find out more about our services
AF
Imran Ahmed
Head of Delivery
Ascensor
Questions this piece answers.
Want a view on your own business? Tell us what you are trying to achieve and we will tell you how we would approach it.
Talk to us
Case studies where this was the work.
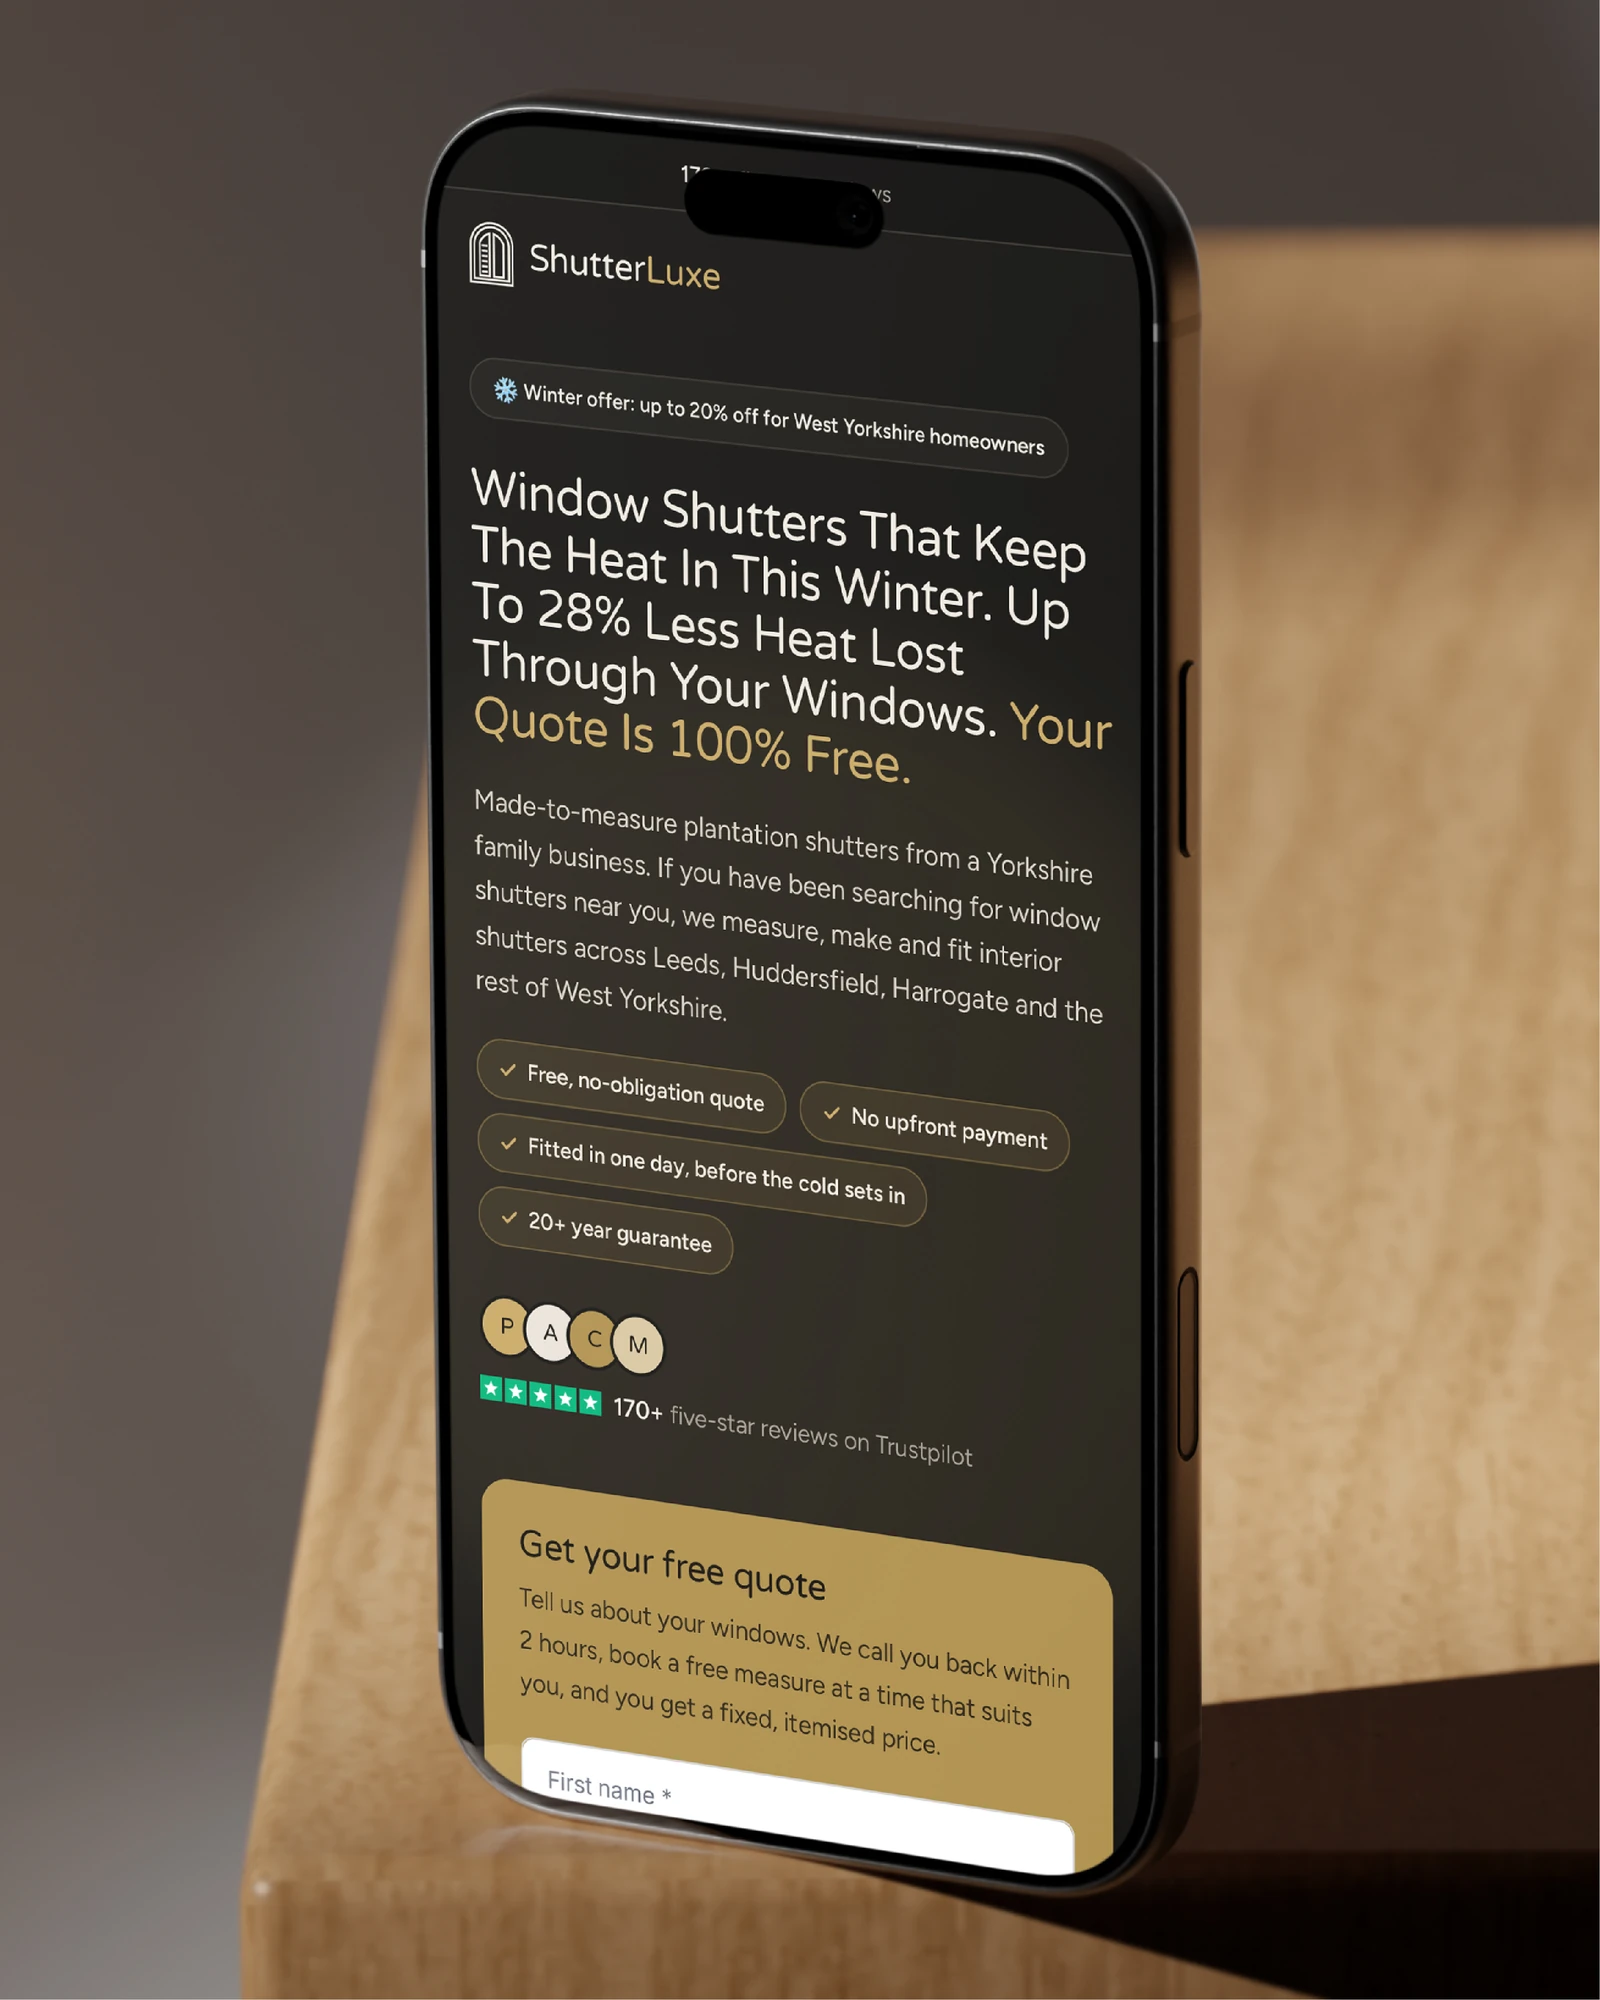
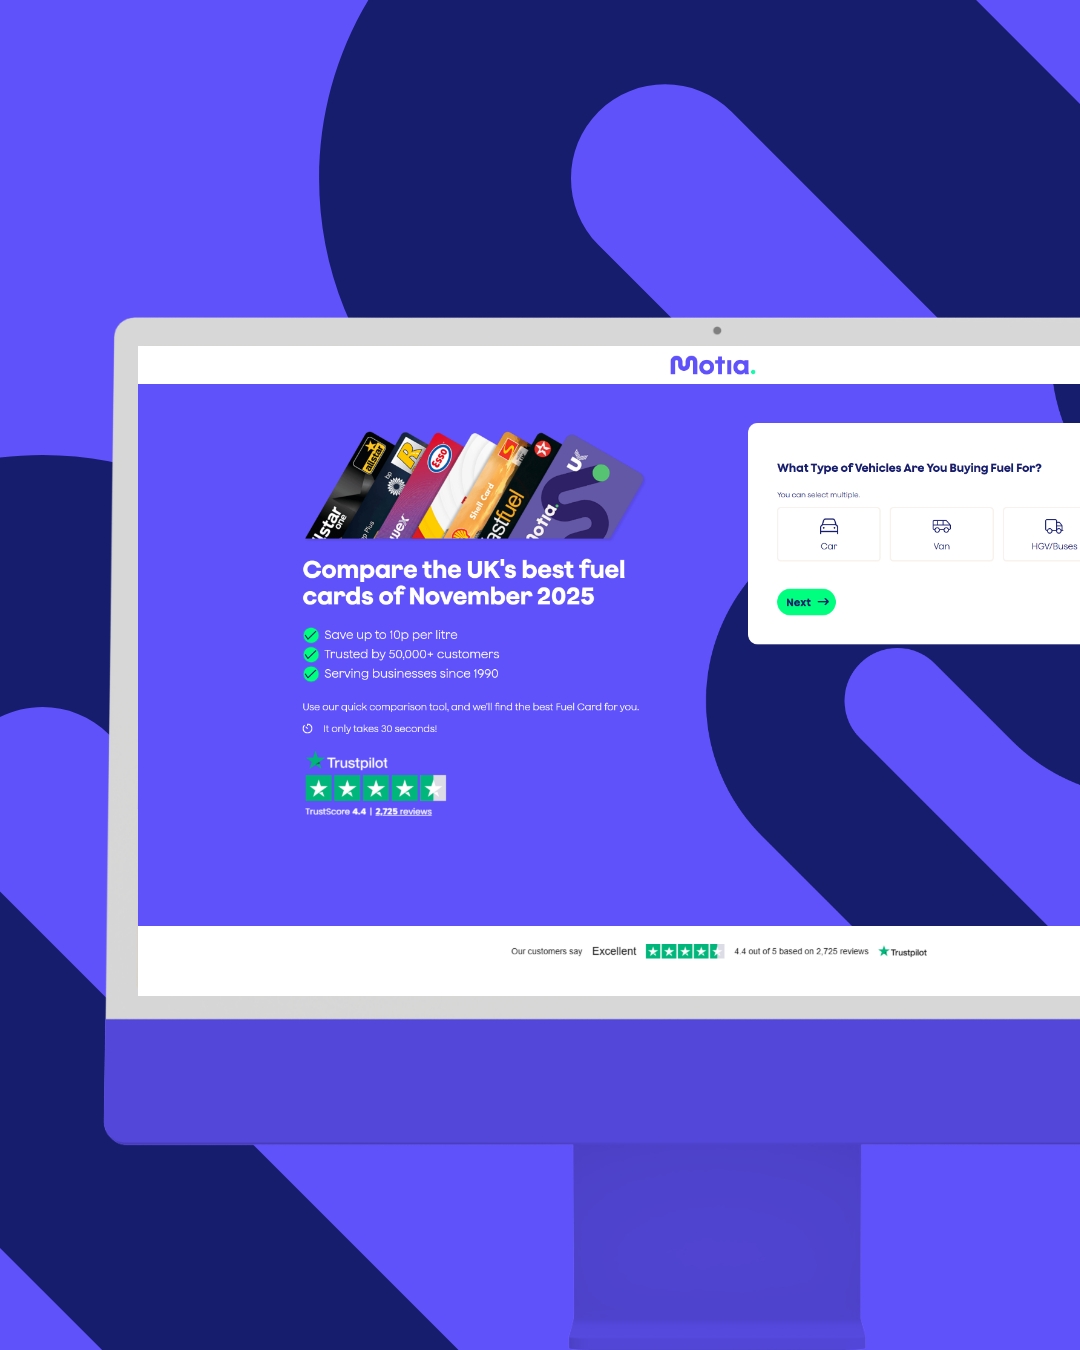
Case studies where this was the work. Each card shows the headline result.
All case studies →
























Want a specialist's view on your business?
A few details is enough to start. We will reply to say how we would approach it.
Prefer to call? 0113 831 4400
Thanks, we have your enquiry.
One of our specialists will reply to say how we would approach it. Want to talk sooner? Call 0113 831 4400.
More insights.




You don't need to go viral to make money from content
A million followers isn't the goal. Nav on why the right 3,000 followers can outsell 30,000, and why every post is a lottery ticket.
content-and-personal-brand